Analyze This: Amphibian populations are on the decline
The chytrid fungus has been wiping out frogs around the world
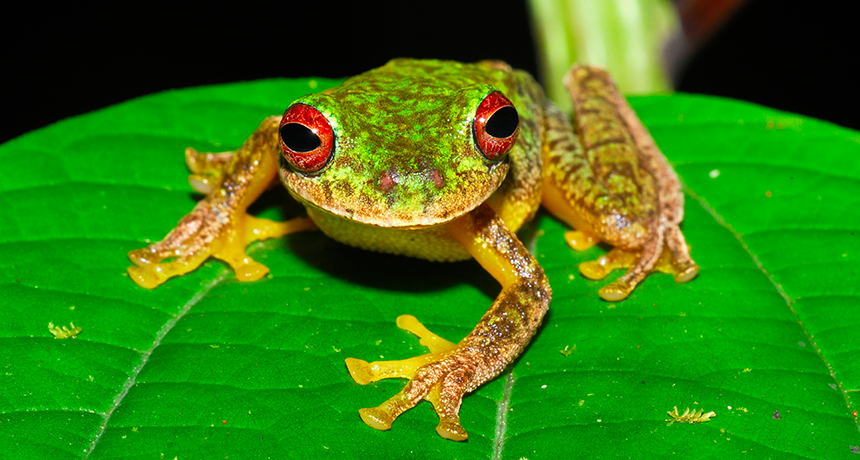
This is an endangered mossy red-eyed frog (Duellmanohyla soralia) from Honduras. Its species is among at least 500 whose numbers have declined due to chytrid fungal infections, a new tally shows.
Jonathan E. Kolby/Honduras Amphibian Rescue & Conservation Center
A deadly disease has been traveling the world for more than three decades now. Called Batrachochytrium dendrobatidis, or Bd, it’s a fungal pathogen that infects the skin of frogs, toads and other amphibians. A related fungus, B. salamandrivorans, infects salamanders and newts. Together, these pathogens are known as chytrids (KIH-trids) because the disease they cause is called chytridiomycosis (Kih-TRIH-dee-oh-my-oh-KOH-sis).
Scientists have known that these pathogens can be deadly. They have documented the effects that chytrids have had on amphibian populations. Now researchers have tallied up the effects of one chytrid, Bd, on species around the world. Their report appeared March 29 in the journal Science.
Bd has played a role in the decline of some 500 amphibian species in the past 50 years, the scientists found. Australia and the Americas have been especially hard hit. But these declines have been occurred around the world, except in Asia. That’s where the fungus is thought to originate.
The pathogen may be responsible for the extinction of as many as 90 species, the researchers report. Others are still in peril. About 40 percent of those 500 species are still declining in numbers. And about one in every four of those species now hold on at less than a tenth of their former population size.
Amphibian declines due to chytrid fungus in Mesoamerica
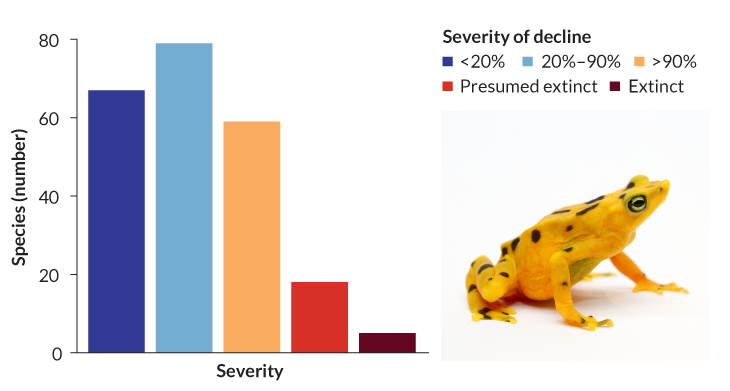
Data Dive:
1. What does each bar in the chart above represent?
2. According to the chart, how many species in Mesoamerica have gone extinct or are presumed extinct due to the chytrid fungus?
3. Can you determine from this chart if there are any species that have not been affected by the chytrid fungus? Explain your answer.
4. What is the overall message of this chart? What does it tell you about the effect of the chytrid fungi in Mesoamerica?
5. Critique the chart. How could you improve it? Is there another way that you could present this data?
Analyze This! explores science through data, graphs, visualizations and more. Have a comment or a suggestion for a future post? Send an email to sns@sciencenews.org.