Chemistry’s ever-useful periodic table celebrates a big birthday
Now 150 years old, this ‘table’ can take many forms, from block charts to spiral trees — and for good reason
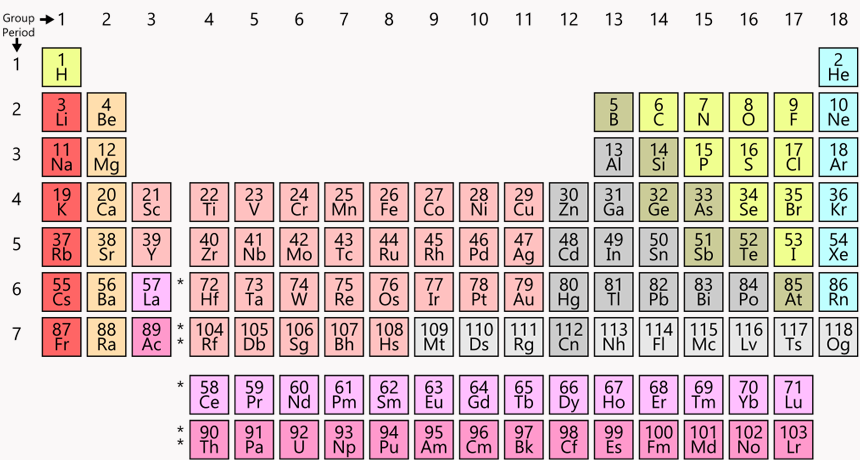
This “twin tower” periodic table is everywhere — in classrooms and museums, even on T-shirts and coffee mugs. Chemists everywhere consult it to understand chemical relationships, to look for data and to plan experiments.
Offnfopt/Wikimedia Commons
Hanging on the wall, the squares look like a jagged wall of alphabet blocks. The letters don’t form words. The columns are uneven. This chart — an icon of chemistry — is known as the Periodic Table of the Elements. Dmitri Mendeleev (MEN-duh-LAY-ev), a Russian scientist working in St. Petersburg, came up with an early version. That was 150 years ago. Yet even today, this chart helps scientists make sense of the atoms and molecules that make up our universe.
Elements are the building blocks of all matter. Their atoms knit together to form literally everything — us, the air we breathe, the organisms that share our world and every other molecule of gas or bit of mass found throughout our universe.
The rows and columns on the periodic table map the so-called periodic law. It holds that shared traits among chemical elements repeat in regular patterns as elements get larger. These patterns link elements with similar chemical behaviors and help to tell chemists how atoms react to form molecules. How the rows and columns on this table line up points to shared traits between groups of related elements. Understanding those relationships helps chemists create new compounds. It also helps them understand how life works. It even helps them predict how new materials will behave.
But Mendeleev’s well-known chart is far from the only periodic table. Scientists have built many, some with widely varying shapes. Chemists designed some. Scientists and teachers in other fields developed others.
“Alternate forms are useful because of the different aspects of the science that they illustrate,” notes Carmen Giunta. He’s a chemist at Le Moyne College in Syracuse, N.Y. Those less traditional periodic tables provide ways not only to highlight some of chemistry’s quirks, he says, but also to bring them into better focus.
In 2019, the world is celebrating the periodic table in all its forms and how it helps organize and make sense of the building blocks of our universe.
It’s elementary
Just after the Big Bang, the universe was made up of only hydrogen and helium — the two lightest elements. Gravity brought these atoms together in ever larger amounts. Eventually this would create dense, fiery hot furnaces that we know of as stars. In the center of these stars, intense pressures fused atomic nuclei — the centers of the atoms — creating larger nuclei.
This slowly forged larger and heavier elements. They included carbon, an element essential for all life as we know it. Those stellar forges also formed the oxygen that we need to breathe.
Making elements larger than iron required even more cosmic firepower. Heavy atomic nuclei formed as massive, dying stars exploded. These supernovas forcefully slammed smaller elements together.
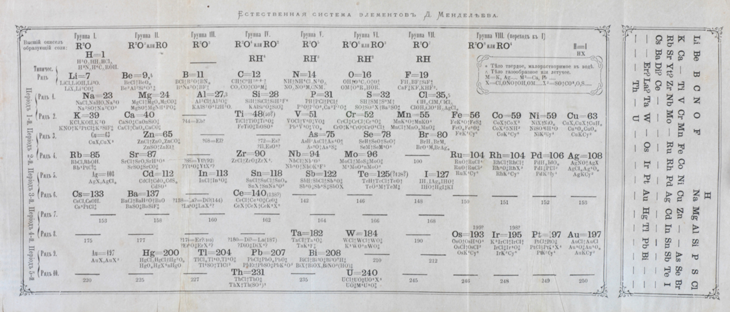
For his 1869 periodic table, Mendeleev arranged the elements in order of ascending mass. He was one of the early scientists who realized that chemistry has repeating patterns. As elements get larger, some of their properties eventually repeat. Certain elements prefer to react, becoming positively charged. Some prefer to be negatively charged. Such patterns allowed scientists to anticipate whether or how different types of elements would likely combine.
In his research journal, Mendeleev wrote that the idea for this table came to him in a dream. He started with a row. But as the chemical properties repeated, he began a new row. He lined up elements with similar behaviors into columns. He left gaps. Those holes, he reasoned, marked elements that likely existed but had not yet been discovered.
When he published that table, Mendeleev predicted the properties and masses of four new elements. Eventually all four were discovered — three within just 10 years.
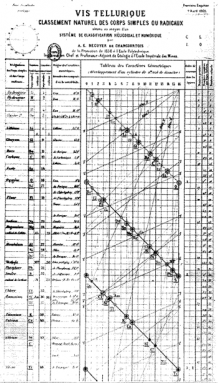
Alexandre-Émile Béguyer de Chancourtois was a French geologist. Seven years before Mendeleev’s famous table, he created a spiral “table.” He arranged elements in order of atomic weight. It showed the repeating periods. It did not, however, show breaks between the rows. Instead, he wound his long, thin chart around a cylinder. In this way, each row flowed into the next. And similar elements lined up above each other in neat columns.
Other scientists crafted similar charts. Before long, efforts to organize all of the known elements snowballed. As all of these charts evolved, one rose to dominate. It’s the one seen today throughout classrooms and textbooks the world over.
Each of the 118 known elements has its own chemical symbol — one or two letters that proudly represent the element’s name from its box on the periodic table. Some of these abbreviations are obvious, such as H for hydrogen or C for carbon. Others date back to ancient times. For example, sodium’s symbol is Na. Why? In Latin, sodium’s name is natrium.
Each box on the table has a whole number, typically in its top left corner. Called the atomic number, it lists how many protons, or positively charged particles, are packed into the element’s nucleus. That nucleus also includes neutrons (particles with mass but no charge). Surrounding the nucleus is a cloud of much smaller, negatively charged electrons.
The bottom number in the chart’s square for each element includes digits after a decimal point. This value is the element’s atomic mass. It represents the average mass of an atom of that element.
The periodic table is simple, powerful and continues to yield new experiments, says Eric Scerri. He teaches chemistry at the University of California, Los Angeles. He also writes books about the periodic table. He describes the organizing principles behind the periodic table as “an absolutely major discovery.”
Dual towers came to dominate
Today’s most common periodic table is sometimes known as the “twin towers” version. Hydrogen (H) crowns the tall tower on the left. Helium (He) tops the right tower.
As atoms get larger, they become more complex. In these charts, a period within the periodic table refers to a row of elements exhibiting some repeating cycle. Within the table, the width of a row — also called a period — is determined so that the pattern of the behavior of elements within a column is maintained. The pattern first repeats itself in two elements, so that row is two elements wide. Then the pattern repeats in eight elements. And as the elements get bigger, Scerri notes, “the periods get longer and longer” — eventually with 18 elements, and then 32.
The longer, larger periods could make the heavy-element base of this table awkwardly wide. To get around this, the twin tower chart usually pulls out part of the bottom two rows. It places these elements at the bottom of the page, almost like footnotes. These lower rows contain groups of elements known as the lanthanides (LAN-tha-nydes) and actinides (AK-tih-nydes).
Actinides include the newest and largest elements. Many are radioactive and do not occur naturally. Physicists instead make them in laboratories by bombarding smaller elements into each other. These radioactive, super-heavy elements are also super unstable. That means they fall apart into smaller elements within fractions of a second.
How they’re useful
A periodic table can serve as a sort of recipe book. The chart shows how elements relate to one another. So where an element sits on the table tells a chemist how it may or may not interact with other ingredients. Often, these useful traits include its mass, boiling point and other important data.
The table’s arrangement helps chemists solve problems. For example, chemists might want to make a new compound with traits similar to an existing one — just better. So they might look for a substitute with similar features, starting with another element from the same column on the table.
The real gift of these tables, says Brigitte Van Tiggelen, is “having all the information in one place and teaching and sharing it.” A historian, she works as the European director for the Science History Institute in Philadelphia, Pa.
The twin tower chart has many advantages, says Mark Leach. He is a chemist in England at Manchester Metropolitan University. No other table manages to show the repeating patterns so well, he argues, all the while including other features.
For example, all the metals are on the left side. Non-metals hang out on the right. This chart also shows how an atom’s size changes and how easily it will likely give up an electron. Such traits are important in understanding how atoms will act, react and marry up with others to form molecules.
But the twin towers chart is not perfect.
Chemists often argue over where to place hydrogen and helium, for example. And a flat, two-dimensional table doesn’t really show how the rows connect to each other. As you come to the end of one row, Scerri says, “You get the feeling that you kind of fall off.”
Roy Alexander worked as an exhibit builder. He didn’t like the way that the rows of the twin tower table abruptly ended. So in 1965 he cut a traditional periodic table chart into strips. Then he put them back together, creating a 3-D version.
Years later, he learned that physicist George Gamow constructed an almost identical table in the 1940s. Recalls Alexander, “It was amazing how identical it looked to my patent drawing.”
Accounting for the increasingly larger periods
When Béguyer de Chancourtois first created his periodic table, many of the largest elements had not yet been discovered. As elements get larger, the shared traits repeated less frequently. Eventually, the longer rows with the lanthanide and actinide elements made the traditional chart awkwardly wide.
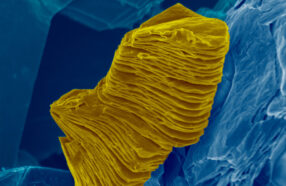
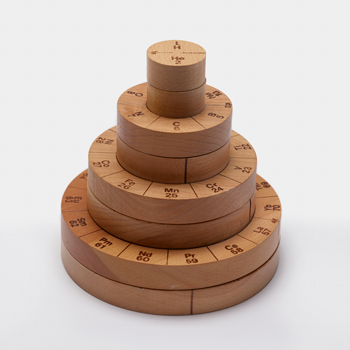
A 3-D table can incorporate these longer rows by simply making the spiral wider. Canadian chemist Fernando Dufour designed ElemenTree to illustrate this (see photo). He made each period as a hexagonal layer that held all of the elements that would usually show up in a single row on the twin-tower chart. Similar elements still line up vertically.
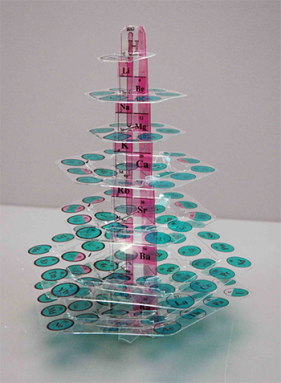
But a tree-shaped table isn’t the only 3-D answer. In the 1950s, chemistry teacher Jennie Clauson relied on a cylinder for her table. But instead of bulging extra elements out, she tucked some of them toward the center.
Another problem with the twin tower table is where to put hydrogen and helium. Hydrogen sometimes acts more like a metal, for example. It will shed its electron and attract negatively-charged ions. Other times it acts like a nonmetal and grabs an extra electron and become negatively charged. Then it acts more like a fluorine or chlorine and sponges up positive ions.
To account for this, chemist Theodor Benfey created a flat spiral table in the 1960s. It put hydrogen and helium in the middle of a big blue circle. Each of three outward spokes within the circle represents a group of similar elements. To include the larger elements and the growing periodic cycles, he added terraces that bulge out of the circle. They include the transition metals, lanthanides and actinides.
A flat table like the twin towers is convenient for hanging on a wall or printing in a book. However, Leach adds, “There’s really no reason why the periodic table isn’t three-dimensional.”
Fun and games?
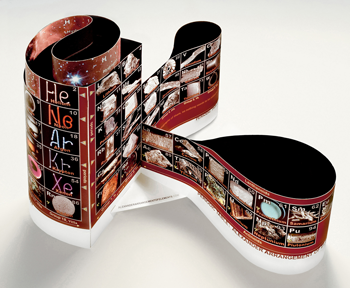
One of the latest additions to the growing library of periodic tables comes from the European Chemical Society, or ECS. Based in Brussels, Belgium, ECS aims to bring attention to the relative scarcity of many important elements. It notes that 30 elements go into making a typical cell phone. And many of those elements are not widely available.
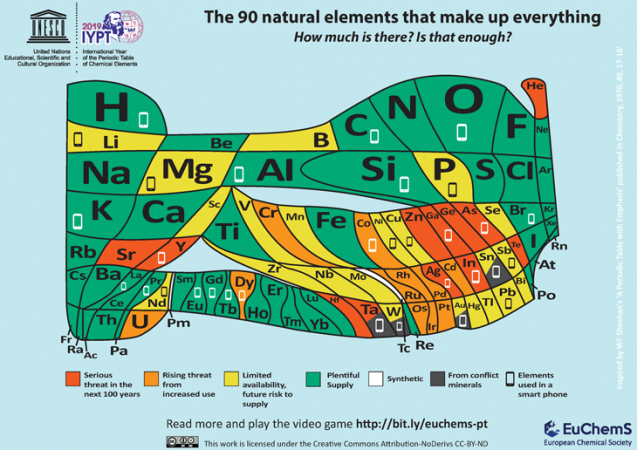
“[W]e need to carefully look at our tendencies to waste and improperly recycle such items,” the ECS argues. “Unless solutions are provided, we risk seeing many of the natural elements that make up the world around us run out — whether because of limited supplies, their location in conflict areas or our incapacity to fully recycle them.”
The ECS acknowledges that this new table is “thought-provoking.” And that’s no accident. It wants people to understand the value in not wasting “endangered elements.” Everyone, it says, needs “to question whether upgrades to our phones and other electronic devices are truly necessary.” And when our electronics die, it says, “we need to make sure that we recycle” so that relatively scarce elements “don’t end up in landfill sites or polluting the environment.”
To explore how people use elements, the ECS has developed a free online video game: Elementary Escapades.
There’s plenty of room for more new periodic tables, says Leach at Manchester. In fact, he has made a hobby of collecting new ones and posting them online. He’s always on the lookout for old ones, as well. “I probably receive a new one every week,” he says.
Scerri has had students develop new ones, too. “Each one,” he says, “has some little virtue of its own.”