Earth breaks heat record for third year straight
Climate change and El Niño drove 2016’s high temperatures
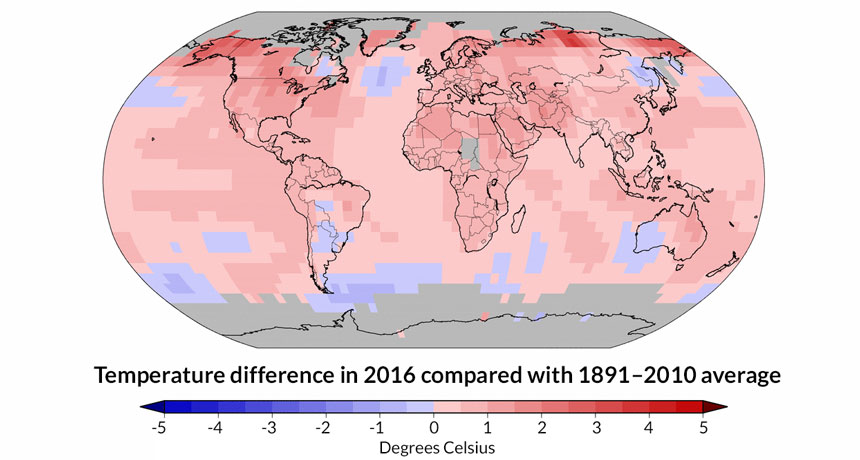
Climate change and warming from the 2015–2016 El Niño helped make 2016 the hottest year on record. In this map, blue areas were cooler than their long-term average temperature; reddish ones were warmer.
NOAA
For the third year in a row, Earth’s thermostat broke a new record: 2016 was the warmest year since record-keeping began in 1880.
Two phenomena spurred this global fever. One was climate change. The other was a monster El Niño — a periodic warming of Pacific waters around the equator that goes on to affect climate across the planet. The global average surface temperature last year was 0.94 degree Celsius (1.69 degrees Fahrenheit) higher than the 20th century average of 13.9° C (57° F). That slightly edges out 2015, the previous titleholder, by 0.04 degree C. Eight months during 2016 set new all-time highs. These included July, which was the warmest month ever recorded.
Scientists from the National Oceanic and Atmospheric Administration (NOAA) and the National Aeronautics and Space Administration (NASA) shared the new heat-wave statistics January 18.
This is only the second time that the annual temperature record has been broken three years in a row, Deke Arndt said in a news conference. Ardnt is chief of the monitoring branch at NOAA’s National Centers for Environmental Information in Asheville, N.C. But the previous trio — 1939 through 1941 — don’t rank within the top 30 warmest years on record, he noted.
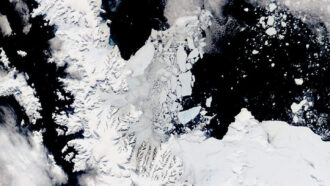
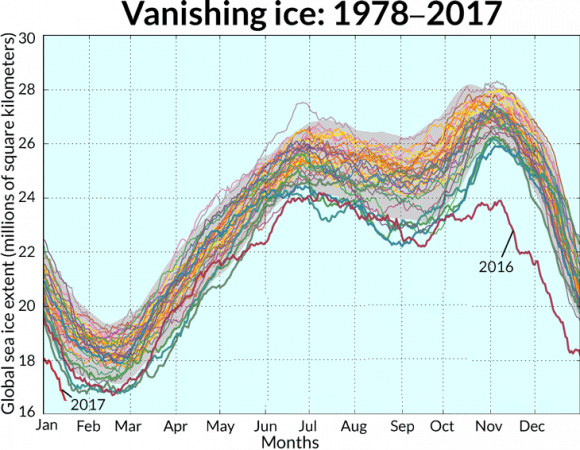
Last year’s heat helped set other records as well. As of January 17, for instance, the global extent (area) of sea ice is at its smallest point in potentially thousands of years. That is according to two types of data. The first are measurements of sea ice by the National Snow and Ice Data Center, based in Boulder, Colo. The other type are analyses of the historical sea ice coverage over the last few thousand years.
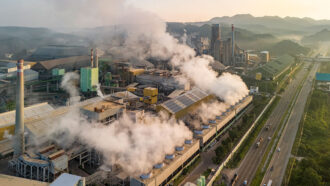
Greenhouse gases released by human activities such as the burning of fossil fuels have cranked up Earth’s thermostat over the past few decades. These gases trap heat that would otherwise escape into space. All 16 years in our current century rank among the 17 warmest on record.
Story continues below graph.
Fossil fuels aren’t solely to blame for 2016’s sweltering heat, says Kevin Trenberth. He is a climate scientist at the National Center for Atmospheric Research in Boulder, Colo. The 2015–2016 El Niño is among the three strongest on record. The phenomenon raised global temperatures by releasing pent-up heat from the ocean into the atmosphere.
The latest El Niño has ceased. But global warming is continuing. Within a decade or so, 2016’s heat will be par for the course even during non-El Niño years, Trenberth predicts. “The temperature record is like going up a staircase. And now with 2015 and 2016, we’ve seemed to go up another step,” he says. In the near future, some years may be a bit higher or lower than 2016. However, he adds, “I don’t think we’ll ever go back to the values we’ve seen in previous years.”