Testing the power of touch
Are fingertips are more sensitive to touch than the arms or back?
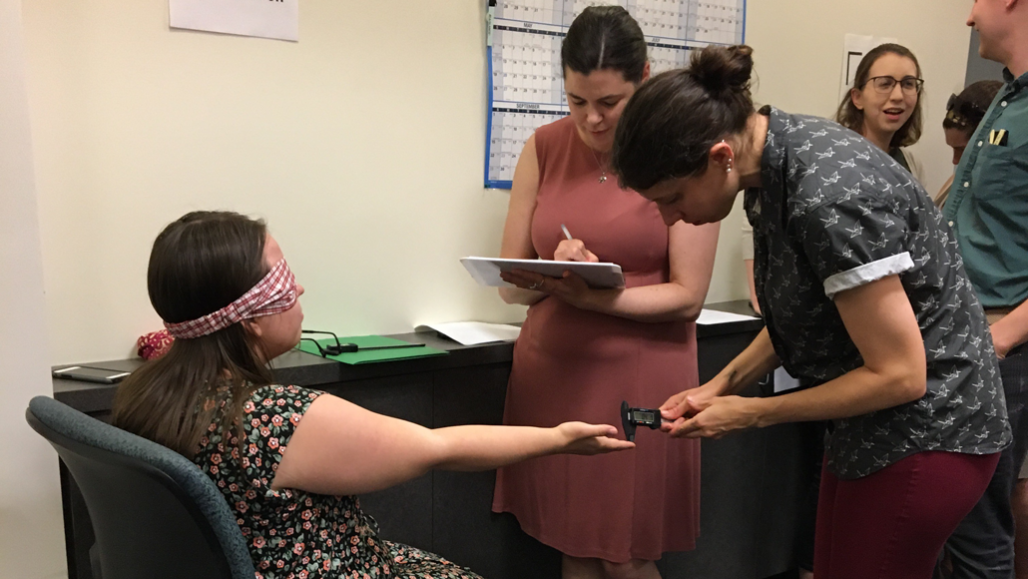
Science News for Students staff writer Bethany Brookshire (right) conducts a two-point discrimination test on a colleague, Cassie Martin (left), as managing editor Sarah Zielinski (center) records the data.
L. Steenblik Hwang/SSP
This article is one of a series of Experiments meant to teach students about how science is done, from generating a hypothesis to designing an experiment to analyzing the results with statistics. You can repeat the steps here and compare your results — or use this as inspiration to design your own experiment.
Your fingertips are sensitive to touch. They have to be, to help you type, get dressed and pet kittens. But are they more sensitive than your leg, arm or back? How would you be able to tell? This is something that’s pretty easy to test. And it’s also easy to turn into an experiment. All you need is something to measure with, a blindfold or two — and a lot of very patient friends.
A test called two-point discrimination can help to determine which parts of the body are more sensitive than others. Two-point discrimination refers to the ability to perceive two points touching you as two actual points instead of one. You can demonstrate this by poking yourself or your friends (with permission, of course). But to turn this into an experiment, I need to start with a hypothesis. This is a statement that I can test.
My hypothesis: Fingertips are more sensitive to two points of contact than the arms or upper back.
Poking and prodding
To test my hypothesis, I need volunteers. But I can’t just run around the office and start prodding my colleagues. It is wrong to perform an experiment on someone without their consent. My friends and colleagues need to know what I am doing, why I’m doing it and if there are any risks.
I wrote up a protocol — a plan of action that details exactly what I am going to do and why. I also drafted a consent form. This is a form my colleagues can read and sign, noting that they understand any risks from my experiment. I submitted the protocol and the form to an Institutional Review Board. This is a group of scientists that determines whether my experimental plan is safe.
The group of scientists I consulted evaluates studies conducted by students at the Regeneron International Science and Engineering Fair reviewed my documents. The board suggested changes I could make to the wording of my consent form, so that no one would misunderstand my experiment. And they approved my study. I was free to do science.
When my colleagues at Society for Science & the Public gathered for a monthly staff birthday celebration, I struck. My editor, Sarah Zielinski, helped as I asked my coworkers to line up, sign a consent form and put on a blindfold. Sarah also wrote down information about each participant’s age, gender and whether they were right- or left-handed.
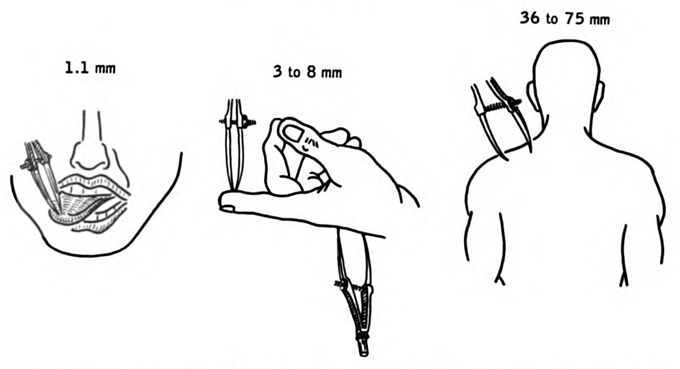
I asked each person to hold out their dominant hand (the right hand, if someone is right-handed). I then carefully touched a pair of calipers to the tip of their index finger. (Calipers are a device that’s used to measure the distance between two points.) I started with the calipers completely closed, forming a single point. Then I moved the points farther apart and touched the person’s fingertip again. Every time I touched their finger, I asked them if they felt one or two points of contact. I widened the calipers each time, testing 0, 0.5, 1, 2, 5 and 10 millimeters (between 0 and 0.39 inch).
At first, people would say they only felt one point. Of course, they did; the calipers were only a single point. But as the calipers expanded, people began to feel two points. Sarah carefully noted when each person felt two points instead of one. I took a measurement of each distance twice.
Then I did the same experiment with each person’s dominant lower arm. I poked them gently about 50 millimeters (2 inches) below their elbow. Each time I asked if they felt one or two points. This time, I tested between 0 and 50 millimeters, waiting to stop measuring when people told me they felt two points of contact. I repeated this on my coworkers’ upper backs.
To make sure I was detecting a difference that wasn’t entirely accidental, ideally I would have tested 41 people. Unfortunately, the experiment took a long time. Many people didn’t want to wait around. They had work to do. I ended up with 38 participants. Not bad.
Dealing with data
After I collected all my data, I organized it in a spreadsheet. First, I de-identified the data. I didn’t leave any information in the spreadsheet that could be used to identify each coworker, including their name. This is important to make sure that everyone is treated fairly and that their information is kept private. It might not seem like a big deal when being poked with calipers. But when studies address diseases such as cancer or depression, privacy is very important.
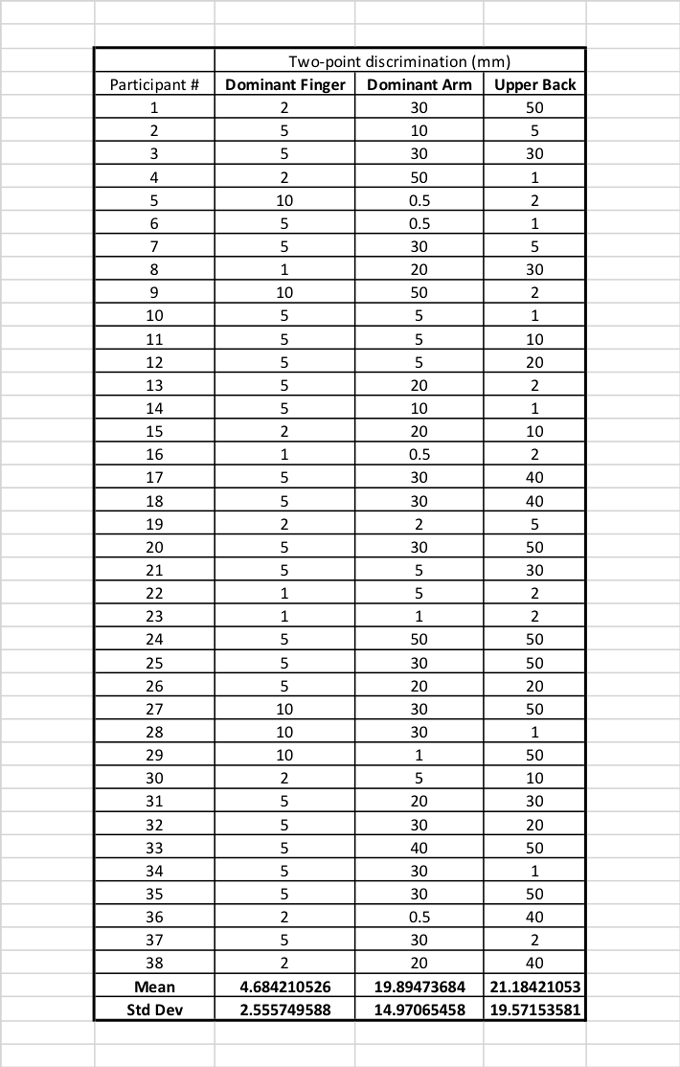
Then I noted at what distance each person reported feeling two points instead of one on their fingertip, arm or back. I organized my data into three columns. At the bottom of each column, I calculated the mean — the average distance that people could distinguish two points instead of one — for each group.
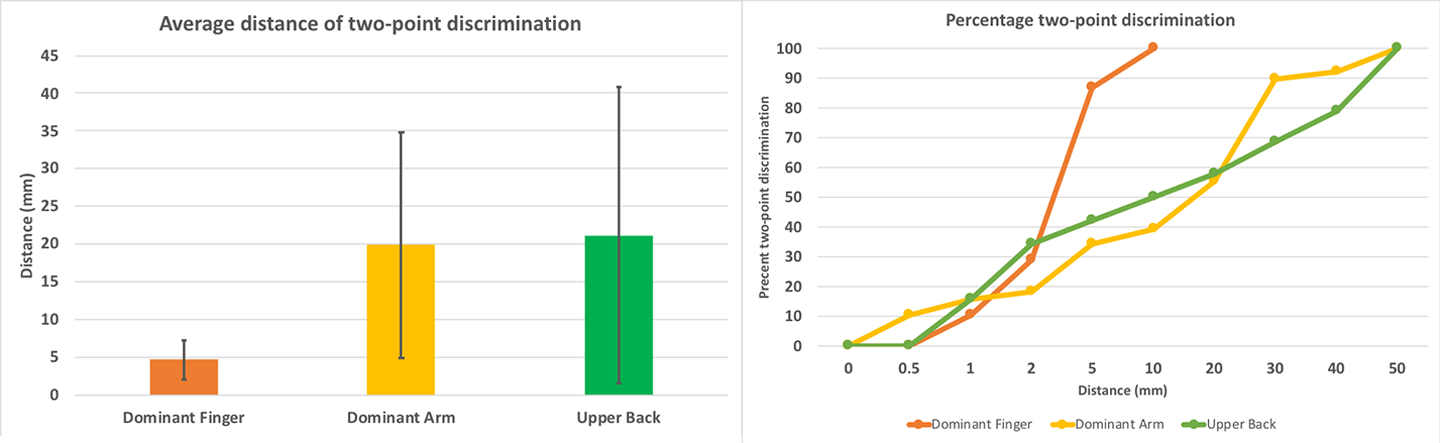
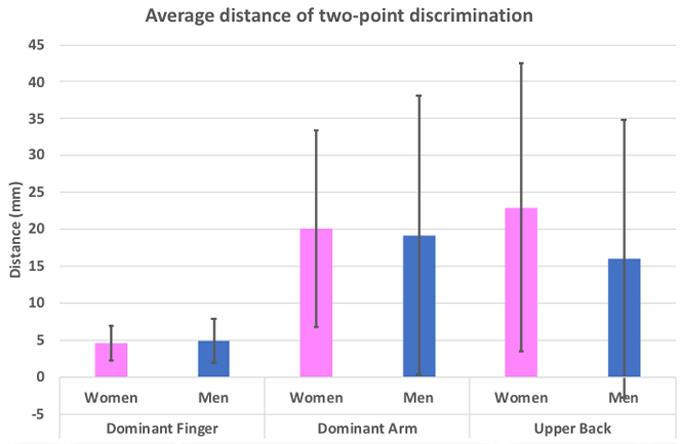
When tested on their fingertips, my coworkers could tell that there were two points when the calipers were only about 4.5 mm (0.17 inch) apart. That’s pretty sensitive. But on their arms or backs, people only noticed that there were two points when the calipers were 20 to 21 millimeters (0.78 to 0.82 inch) apart. That’s still not very far. But it’s not nearly as sensitive as the fingertips.
Or is it? If you look at my data, you can see that my results varied wildly. Some people could tell there were two points on their arm when the calipers were only one millimeter (0.036 inch) apart. Others couldn’t tell at 50 millimeters (almost two inches).
To find out if my groups really were different, I had to run some statistics. These are tests to interpret the meaning of my results. I performed an analysis of variance, or an ANOVA. This test is used when someone wants to compare the means of three or more groups. There are free calculators for this online. I used the one at Good Calculators.
The test produces a p value, a measure of probability. It measures how likely it is that I would find a difference between these three groups as big or bigger than the one I found, if the difference itself was accidental. A p value of less than 0.05 (or five percent) is considered by many scientists to be statistically significant. In this case, my p value was so small it came out as a zero. This is a 0 percent chance that I would see a difference this large by accident.
So it looks like there could be a difference between the fingertip, arm and back. But where is that difference? To find out, I need to run a post-hoc test. I used a test called the Tukey’s range test. It individually compares all the means between the three groups. It compares the finger to the arm, and the finger to the back. It also compared the arm to the back. Again, you can find this test for free on the internet. I used the one on GraphPad.
That showed me that the fingertip was significantly different from the arm. It was also different from the back. But the arm and back were not different from each other.
I made two graphs to show off my results.
My results are backed up with knowledge about how the body processes touch. When you are poked or prodded, molecules called receptors in the skin sense that touch. They send signals down nerve cells and to the brain, letting you know you’ve been poked and where.
The ability to feel two points touching your skin is an indicator of how many receptors for touch you have in that body part. Your fingertips have 100 times more receptors for touch than your back. There are also fewer receptors on your arm than your fingertip. So it makes sense that you would be able to discern two points at a closer distance on your hand than your back or arm.
Oh no, we’re not done
While my experiment supports my hypothesis, my data also varied a lot. Was there something that I could be missing?
For example, maybe my data varied because men were more, or less, sensitive to touch than women. So I graphed my data by gender. Only 10 men participated in my experiment, compared with 28 women. But my data was just as variable in both groups, and the groups were not different.
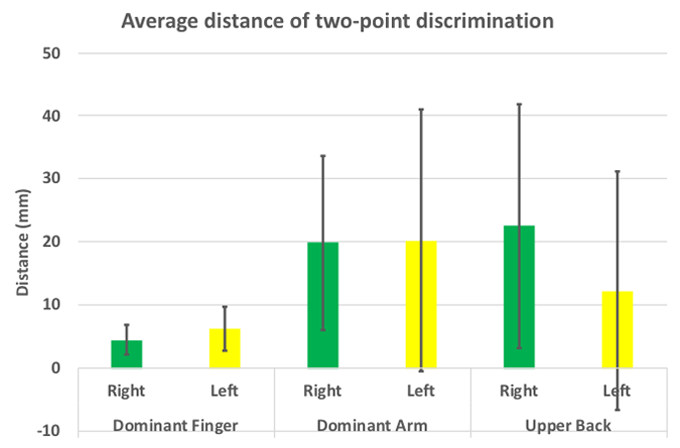
What about handedness? Five of my participants were lefties. So I separated out the right- and left-handed people in my study. But lefties did not appear more variable in their responses than righties.
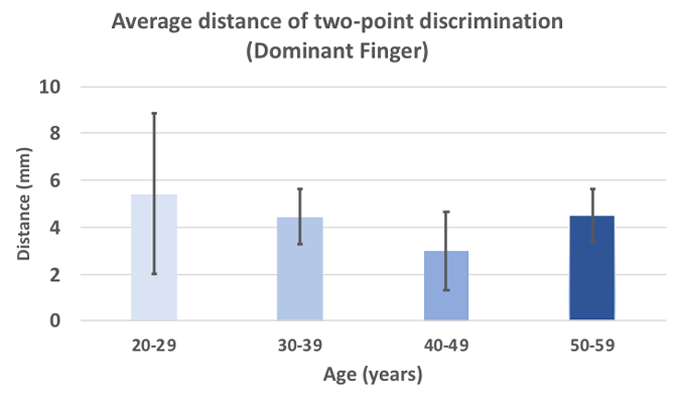
Finally, I separated my groups out by age. The youngest person in my experiment was 20 and the oldest was 66. Could age change how well people can feel two points instead of one? In my experiment, no. The average distance for two-point discrimination wasn’t different based on age.
There’s no such thing as a perfect experiment. And if I were to try this experiment again, there are many things I would do differently. I would try to get equal numbers of men and women, to start. I could try for equal numbers of right- and left-handed people. I could also try to make sure I studied only one age group, or that I studied all age groups equally.
But the next time you want to feel just how close together two points are, I’ll use my fingertips. Not my back. My experiment showed me that much.