2013 U.S. Report Card on reading and math
The data are in, but the interpretation is still up for grabs
The 2013 Nation’s Report Card results are out! The National Assessment of Educational Progress, or NAEP, looks at test scores in math and reading for fourth and eighth graders and contrasts them across all 50 states. Compared with scores from 1990, this year’s math scores were 28 points higher for fourth graders and 22 points higher for eighth graders. In reading, scores went up by five points in fourth grade and eight points in eighth grade compared with scores from 1992.
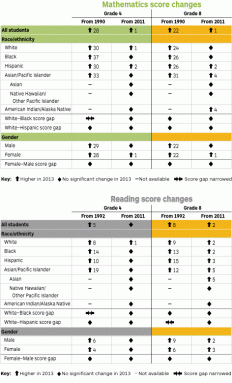
But classrooms have changed a lot since the 1990s. Many schools now make accommodations for those who need more time, such as students with learning disabilities or those for whom English in their second language. When compared with scores from 2011, the improvements this year were quite modest. In math, scores crept up about 1 point for fourth and eighth graders. Reading scores remained unchanged among fourth graders and increased by only about two percentage points for eighth graders.
U.S. Secretary of Education Arne Duncan sees even these small improvements, as a sign of important progress. “Given the rapid and comprehensive changes that America’s educators are implementing in classrooms across the nation, it is to their credit that we are seeing the strongest performance in the history of the NAEP,” Duncan said in a press release. He is referring to the recent implementation in some states of Common Core Standards designed to help prepare kids for college. Some states have begun implementing them; others are still preparing to do so.
Regardless of whether they had adopted the Common Core Standards, some states performed better on the new report card than others, In particular, southern states seem to perform below average on both reading and math.
The website for the Nation’s Report Card has gotten a nice makeover. You can review scores state by state, focusing on factors such as gender or ethnicity. It’s a great tool to try to make sense of the numbers.
And making sense of those data will prove the challenge. The data show how much scores have changed over time and between states. But what do those changes signify? Don’t we really want to know why one state has fallen behind and another surged ahead? While the scores are clear, their meaning is not.
Nothing has changed about the test itself since the 1990s. The only change has been to allow kids who need it to receive accommodation when taking the test. Despite awareness and efforts to change how we educate, big changes still persist. Boys still outperform girls in math, though the difference is only by one point. Girls still out perform boys in reading. The gap is narrowing in fourth grade math, but on average, white children still have higher scores than black children. Whites also still have math scores 26 points higher than Hispanics.
And while we have the numbers, we still have to wonder. Why do these differences persist? Why are some state’s scores so much higher than others? Breaking down the data can yield some answers. For example, looking at students who qualify for free lunches offers one gauge of low household income. More than three quarters of kids performing below average in mathematics also qualify for free school lunches. Poverty levels are clearly tied to performance. What does it mean? And how should we as a nation develop policies to address this disparity?
Kids who are not native English speakers did not perform as well as those who were. Jack Buckley, a commissioner for the National Center for Education Statistics, says that this means states with higher shares of English language learners will probably have lower scores. Does this mean we should change how we distribute educational resources to these areas?
Buckley is optimistic that the new data can help us develop better policies to deal with score differences due to demographics. “Demographics are not destiny,” he says. Data from the Nation’s Report Card could be used to help us get educational resources to those who need them most.
He’s right: The data are out there, and easily accessible. What matters now is what we do with them.