Why sports are becoming all about numbers — lots and lots of numbers
Many teams now rely on math to beat opponents and develop tactics

People all over the world love soccer. Today, technology and data analysts help coaches evaluate players in this and other sports. That improves training sessions and helps teams perform their best at games.
Pollyana Ventura/E+/Getty Images Plus
Growing up near Montreal in Canada, Sam Gregory’s life revolved around soccer. “I played. I refereed. I coached,” he recalls. “I was totally obsessed with it.” He also cared about team statistics. But he never saw himself finding a career that married the two. Today, he’s a data scientist for Sportlogiq in Montreal. He and his colleagues analyze data — numbers, really — on soccer, ice hockey and other team sports.
Gregory was one of many kids who grew up loving team sports. Most didn’t realize that math helped decide who would play on their favorite team. Or that it guided how players would train and what equipment they might use. Of course, teams don’t call it “math.” To them, it’s sports analytics, team stats or digital technology. But all those terms describe numbers that can be crunched, compared or tallied.
Data scientists like Gregory often focus on team performance. They might measure ratios of wins to losses or runs batted in. The numbers might be games played without an injury or goals per time on the field.
Coaches have come to realize that such statistics are valuable. They can guide strategies for beating the next opponent. They might also suggest which practice drills or recovery routines will help players perform best at the next matchup.
And technology for tracking all those numbers isn’t just useful for professional athletes. It also lets the rest of us record and improve our workouts.
From baseball to soccer
People often use data and information interchangeably. In fact, they are not the same thing. Data are simply measurements or observations. Analysts sift through those data to look for something meaningful. That often requires computer calculations. The end result is information — that is, trends or other things that inform us.
Sports analytics started with baseball. Here, batting averages and similar measures have been tracked for more than a century. Around 2000, some people went well beyond those simple stats. They crunched data to identify — and hire — talented players that other teams had largely ignored. This let a baseball team with a small budget create a roster that could beat wealthier teams. Michael Lewis wrote about it in the 2003 book Moneyball (which became a movie by the same name).
Other ball sports soon hopped on the sports-analytics bandwagon. Wealthy clubs in the English Premier League were the first to build analytics teams for soccer (what the league and most of the world calls football). Other European and North American leagues followed. Soccer coach Jill Ellis led the U.S. Women’s National Team in back-to-back World Cup championships. She credits analytics with some of that success in 2015 and 2019.
Today, companies like Gregory’s Sportlogiq help many soccer clubs prepare for upcoming games. That means analyzing the opponent’s previous performance. Analysts unleash computer software to “watch” lots of videos. The software can summarize data faster than people can, and from any number of games.
Those summaries help clubs identify the key players they need to guard. They point to sets of players who work well together. And they spot field sections where the opponent tends to attack or press.
The NBA . . . by the numbers
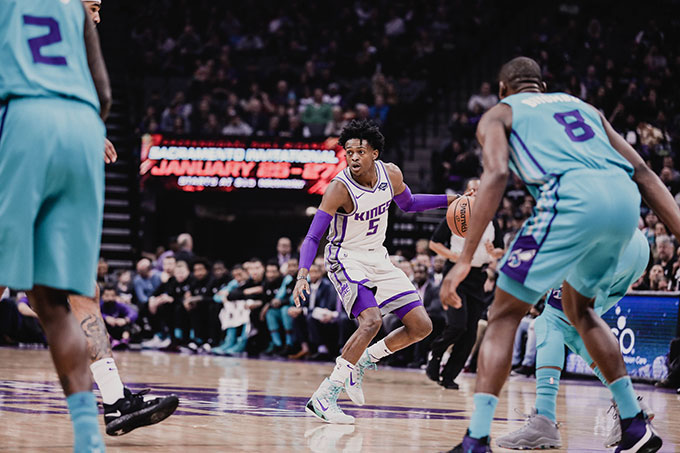
Gregory works with many clubs. Matthew van Bommel dedicates his efforts to just one: the Sacramento Kings. This National Basketball Association team comes from California’s capital city.
Like Gregory, van Bommel grew up in Canada. He, too, played sports as a kid — in his case, basketball, baseball, soccer and tennis. With a master’s degree in statistics, he joined the Kings in 2017. Today, he writes computer code to crunch basketball numbers.
“Coaches review shooting stats, fast break points and points in the paint,” van Bommel explains. (The last of those are points scored within the court’s painted free-throw lane.) Computers summarize all these numbers in charts. Coaches quickly scan these charts to make tactical adjustments while a game is underway.
It takes longer to process the information gleaned from game videos. But these post-game reviews allow for deep dives into the data. Shot charts are one example. “They show which locations on the court produced the shots most likely to go in,” van Bommel explains. Coaches can create drills to help players focus on those shots.
By 2014, every NBA team had installed cameras in its arena to track the movement of all players and the ball. These cameras generate large amounts of complex data every week. All those numbers inspire the creativity of van Bommel and his colleagues. They brainstorm new ways to turn the numbers into useful information.
Coaches and managers also use analytics to recruit new players for teams. That matters for online fantasy-league games as well. Here, players assemble an imaginary team of real athletes. Then, over the season, they score points based on how those athletes performed for their actual teams.

What about equipment?
Data have led to the redesign of equipment, too — from football helmets to soccer balls. Scientists have studied the role of spin and surface roughness in a baseball’s trajectory. They’ve measured friction in a knuckleball’s seemingly knucklehead path. In some sports, performance also depends on the ball-hitting equipment. Examples include not only baseball, but also hockey and cricket.
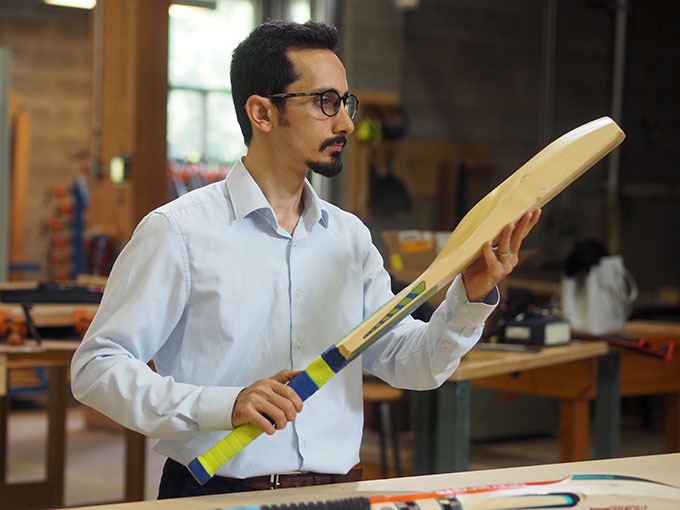
Cricket is as popular in India as soccer is in Europe, notes Phil Evans. But there’s a difference. Most kids in Europe can afford a soccer ball. “Millions of kids in India can’t afford proper bats,” says Evans. He is a wood scientist at the University of British Columbia in Vancouver. While he works in Canada, he hails from England, where he grew up playing cricket.
In 2015, Evans was visiting the Australian National University in Canberra. He and his colleagues talked with Brad Haddin about cricket bats. (Haddin is a famous Australian cricket player.) English willow has long been considered the ideal wood for those bats. The tree grows best in eastern England and is quite expensive. But Haddin argued that the bat’s design matters just as much as the wood from which it’s made.
So Evans decided to look for a less costly substitute. “Poplar is very similar to willow,” he notes. And, he adds, it doesn’t cost nearly as much. It’s grown in plantations and is widely available in Europe and North America. But how could he find the best design for a poplar bat?
Evans had the perfect graduate student for that task. Sadegh Mazloomi, a mechanical engineer, had the skills to design a bat with a computer algorithm (AL-go-rith-um). That’s a series of step-by-step mathematical instructions to solve a task, often using a computer. In this case, those steps worked out the shape of a bat that could hit a cricket ball as efficiently as possible.

The instructions often come with some constraints. Like all ball sports, cricket is subject to official regulations. The dimensions of the bat can’t exceed certain limits. For example, it can’t be longer than 965 millimeters (38 inches).
What many bat designers had varied in the past was the bat’s thickness (or height) at 28 points along the back. The regulations limit the range of each height. Those heights affect how the bat’s mass is distributed. And that affects the bat’s mechanical properties.
Mazloomi placed those 28 height limits on a computer’s 3-D model of a real bat. The algorithm varies each of the 28 numbers in small amounts. Then, it recalculates the distance between two other special points on the bat. A smaller distance means fewer vibrations when a ball hits the bat. Other researchers already had proven this with the laws of physics. With fewer vibrations, players can transfer more hitting power, or rebound energy, to the ball. Thus, minimal vibrations at the bat’s “sweet spot” result in peak power.
Testing all possible height combinations takes a modern computer about 72 hours. In the end, that number-crunching turns the optimal design into instructions for robotic machinery to carve the desired piece out of wood. The robot then fuses that wood onto a standard cane handle. And voilà, the Algobat is ready!
“The Algobat’s shape is similar to today’s best commercial bats but also has some novel features,” Mazloomi says. Craftsmen have improved cricket bats for centuries. “Running computer code for 72 hours almost matched that human ingenuity,” he adds.
Mazloomi and Evans built their prototype out of wood from local fir trees. But changing that to poplar or any other type of wood is easy. The computer adapts the robot’s carving instructions to each material’s unique properties.
The researchers are now testing poplar Algobats on real cricket fields. Ultimately, Evans hopes a company will produce these bats for a cost of less than $7. That would be affordable for many kids in India. But cheap raw material is not the only thing that matters. The price also will depend on the company’s cost for equipment and labor.

Educators and Parents, Sign Up for The Cheat Sheet
Weekly updates to help you use Science News Explores in the learning environment
Thank you for signing up!
There was a problem signing you up.
Data scientists: The new kids on the team
Data analysis can boost not just athletic performance, but also health and safety. The growing demand for this information also creates new jobs that require data-science skills.
Many colleges have designed new programs to teach these skills. In 2018, Liwen Zhang graduated from Boston University with a master’s degree in statistics. As part of a student team, she built a web app for women’s basketball at the school.
For each player, the app provides performance summaries from game events, such as rebounds. (In basketball, scorekeepers have manually recorded these events for years.) For example, a player’s defense score combines counts of their defensive rebounds, blocks and steals. Personal fouls reduce the score. The final number summarizes how much the player has contributed to the team’s overall defense.
Coaches can review scores for defense and offense throughout an entire game or just for certain time periods. They can study one player at a time or several together. “Our app helped the new coach get to know his team,” Zhang says. “He learned which combinations of players work well together and how players perform under pressure.”

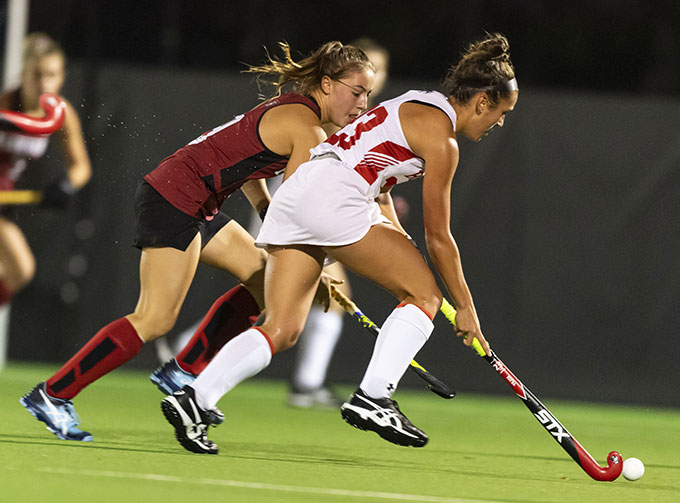
In fall 2019, a new group of BU students worked with Tracey Paul. She is the assistant coach for women’s field hockey there. Paul wanted to combine player data from wearable devices with spatial information from game videos.
The devices are attached to a player’s back and record her position at every second. They use the same GPS technology as smartphones. (This satellite-based Global Positioning System was invented in the 1970s.) The devices calculate player speed as distance traveled divided by time.
One measure of special interest to Paul is a player’s so-called “load.” It’s a summary measure of all accelerations. (Acceleration is the change in speed per unit of time.) This load tells the coach how much work a player did during a training session or game.
The BU students developed an app that combines video tags with player data from the wearable devices. (The video tagging is done manually right now but could be automated in the future.) The tags mark game events of particular interest, such as turnovers — when a team loses possession of the ball to its opponent. Paul can review a visual summary of all player loads during a turnover. With this information, she can design practice drills to help specific players react faster in critical moments.

The app also shows player loads for areas of interest. This may be the shooting circle around the goal or a field quarter. This lets Paul compare a player’s actual effort with her team position (forward, midfielder or fullback). Such data also help Paul design recovery routines to reduce a player’s risk of injury.
All those performance numbers provide valuable information. However, they can’t capture everything that matters. Team chemistry, for example — how well people get along — will likely remain hard to measure. Researchers have tried to quantify how much the coach contributes, says Gregory of Sportlogiq. But it’s hard to separate the coach’s contribution from that of the players and the club’s other resources (such as its money, staff and facilities).
The human element is one reason why people enjoy watching and playing ball sports. Says Gregory, “Players are real people with real lives, not just data points.” And, he adds, “No matter what the statistics say, everybody has good and bad days.”


