Endangered or just rare? Statistics give meaning to the head counts
To help rare birds and exotic carnivores, experts collect and dig into data on them
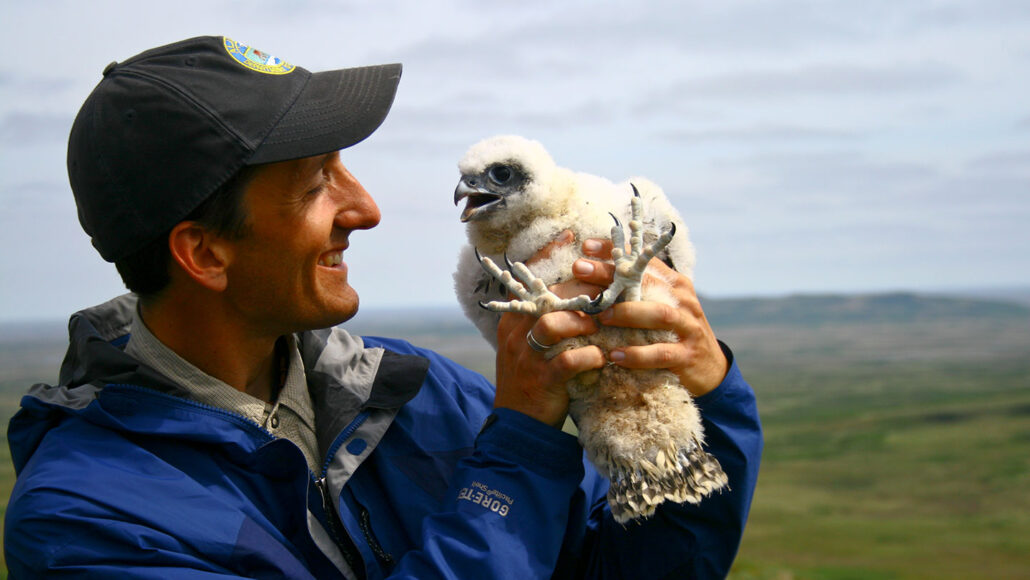
Wildlife biologist Travis Booms holds a young gyrfalcon. “It's really important that biologists have a basic understanding and foundation in statistics,” he says. That understanding helps him study birds and other animals for the Alaska Department of Fish and Game.
Robert Goodwin
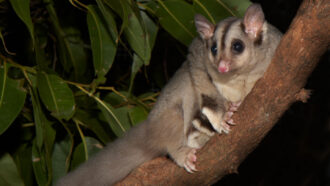
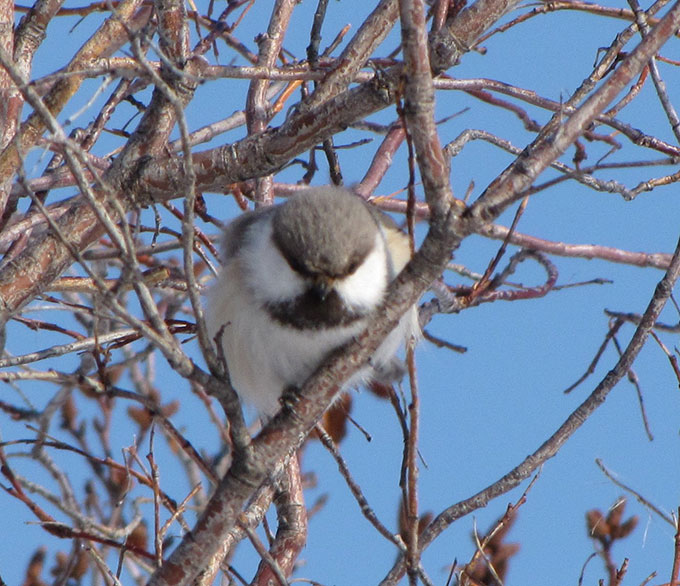
Travis Booms scoured remote Alaska searching for a tiny bird. Not just any bird. He wanted evidence the gray-headed chickadee still existed here.
Booms works for the Alaska Department of Fish and Game in Fairbanks. His job focuses on maintaining the diversity of Alaska’s wildlife. Mostly, he collects data on rare or declining species. He hopes the data he gleans can help prevent them from becoming threatened or endangered with extinction.
Take the gray-headed chickadee. Booms looked for seven long years. One day in 2011, he and his field partner were playing bird recordings near a small river. All of a sudden they heard a chickadee call back. So they kept playing the recorded bird call. At last the bird “came down from a very tall spruce tree and flitted around us.” Within a minute, it was gone.
It’s still the only member of its species this wildlife biologist has ever set eyes on. Despite hundreds of hours of searching, Booms considers himself lucky to have seen even one. Even a single sighting “is a really special moment,” he says.
Hoping to turn up reports of gray-headed chickadees elsewhere in North America, Booms and his colleagues analyzed historical records. Some dated back more than 150 years. Their final tally: 156 birds.
When studying such rare species, biologists such as Booms often turn to statistics. This field of research helps them make sense of numerical data.
“I’ve never really been all that excited about statistics,” Booms says. But he relies on it “to understand what does excite me. And that’s wildlife.”
His team used statistics to conclude that the range of the gray-headed chickadee has shrunk in North America. The species’ population “is very small,” they report in the December 2020 Journal of Fish and Wildlife Management. If there’s any hope of saving this bird, they say, more must be done to understand its role in ecosystems.
To some scientists, such as Booms, statistics can be a bit like eating veggies — important, but not the most fun part of their work. For others, statistics is more like a huge, cherry-topped ice cream sundae they can’t wait to dig into. But to both groups, statistics is a powerful tool.
Whether the subject is sea turtles, racism, hurricanes, food safety, new tech or disease, any research that involves making sense of data will likely use statistics. It can be used to spot important trends. In fact, without statistics, many researchers could not draw meaningful conclusions from their data. Here we meet several researchers who use statistics to better understand animals in the wild and how to help protect them.
Pattern detectives
Statisticians search for patterns in numbers. To do this, they evaluate how different things relate to each other. Sometimes they can even use what they find to predict the future.
Consider Leslie New. Shortly after getting her PhD in statistics and biology, she did research at the Patuxent Wildlife Research Center. Part of the U.S. Geological Survey, that center is based in Laurel, Md. New studied death rates in eagles from collisions with wind-power plants. She used these stats to predict how many of the birds might die if more turbines were built.
New and her colleagues estimated about seven or eight golden eagles would be killed per year at one site if a wind facility were built there. After the turbines went up, they kept track of eagle collisions over the next two years. The average — about five fatalities per year — proved even lower than they had predicted. Statistics gave them “a way to be careful and promote conservation from the very beginning,” New says. Then they use the new data to make their next estimates more precise.
One neat thing about statistics, New says, is that she can use similar techniques to analyze data on species that lead very different lives. Now at Ursinus College in Collegeville, Penn., she’s turned her skills to studying marine mammals, such as dolphins and whales.

Digging into dolphin data
Statisticians don’t just scout for patterns. They also test if some apparent pattern might simply be due to chance or error. When two or more things seem linked, that’s called a correlation. Causation describes where one thing leads to another. And that’s a statistician’s goal: evidence of causation.
They start hunting for it by doing what may seem odd. They assume any correlation they see is only due to chance or measurement error. This is called a null hypothesis. Then they collect evidence to test whether that null hypothesis is true.
For instance, New has studied how dolphin-watching boats might hurt — but not kill — marine mammals. Noise from boats and people could drive dolphins away from their preferred habitat. It might also deter them from eating or make it difficult for them to reproduce.
New doesn’t focus on whether disturbances annoy dolphins for a short period of time. She also doesn’t concentrate on whether noise causes long-term harm to a very small number of dolphins within a large social group. Instead, she looks at whether noises affect the health of the population. If many dolphins are getting shooed away from an area or are too scared to eat or reproduce, that could hurt their whole community.
How might one test the null hypothesis here? Look for data showing that dolphins are leaving their habitat. Are they moving away from food or having fewer babies. Now assess whether such changes are due to natural fluctuations (such as in weather or the availability of food). Also look what errors could be due to how the data were collected. Researchers could even study two populations of dolphins equally impacted by boat noise. Do they respond the same way? If not, the reason may be due to issues other than just the noise.

New has tested these ideas by feeding data into computer models. The models simulate four well-studied dolphin populations, each exposed to noise from dolphin-watching boats. She wanted to test whether there were situations in which boat noises posed a potentially serious threat, versus just discouraging the animals at that moment.
One simulation focused on dolphins near Doubtful Sound. It’s on the southwest side of New Zealand. Another modeled animals near Florida’s Sarasota Bay. A third focused on dolphins along South Africa’s eastern coast. The last modeled dolphins off the southeast coast of Australia.
Each group of dolphins was a different size. They also had different types and amounts of available food. Some of the populations were tightly knit and spent their whole lives in one area, New says. Other, more open groupings let visiting dolphins join for a year or two.
“Closed populations were most sensitive” to the effects of boat noise, New and her colleagues found. Large, open populations with ample access to food seemed less affected. It appears, New says, that when noise bothers only a few members of a really big group, “the population as a whole isn’t going to be affected.” After all, losing a few dolphins out of a group of 600 is going to have a much smaller impact than losing the same number out of a group of 60. And when an open group is harassed by noise, those who are bothered may just move on.
All of this is what biologists might expect, based on animal behavior. But, New adds, it’s “always helpful” to find that math backs that up. Such findings also could be used to make decisions about when and where dolphin-watching boats are allowed to operate.
She and her colleagues reported their findings May 26, 2020, in Frontiers in Marine Science.
Sizing up samples
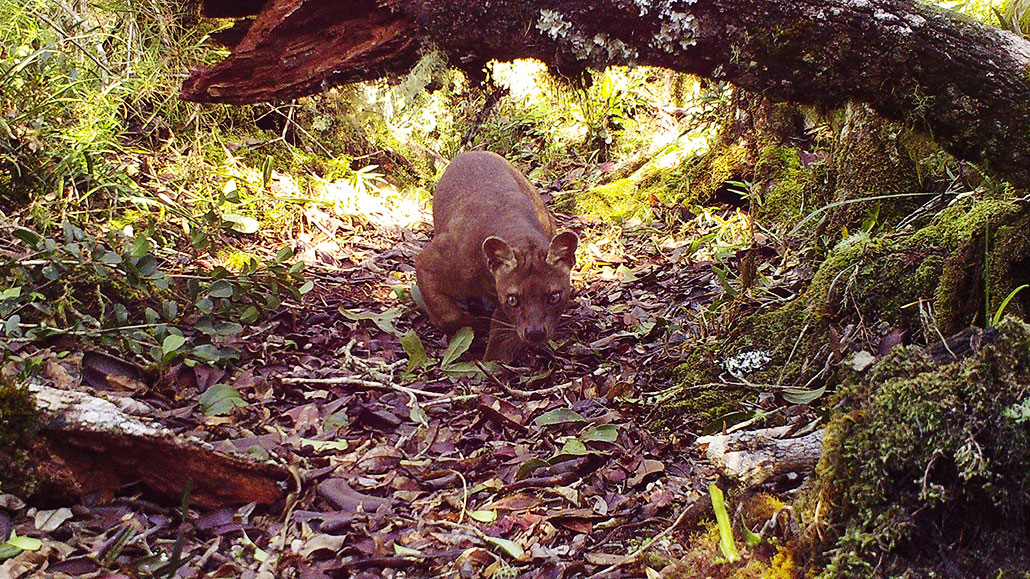
Zach Farris is a wildlife conservationist. Although he works at Appalachian State University in Boone, N.C., he studies animals on the East African island nation of Madagascar. Among these animals are lemurs and fosa (FOOS-uh), the island’s largest living carnivores. Farris also looks at how pet dogs and cats affect wild animals in the island’s protected rainforest.
Like New, in his work “animals are just numbers,” Farris says. “We piece together their stories” from those numbers.
For one recent study, Farris collected data using 35 cameras. These camera “traps” were set out in a rainforest to snap a photo of anything that moved nearby. The government had just expanded the protected part of that forest. Farris wanted to know what carnivores lived in this new area. It might help define how diverse the area’s species were.
In all, they snapped pics of at least 40 different species. These included lemurs, small mammals and birds. Some were important prey for the carnivores. Others, Farris notes, “serve as indicator species.” By that he means they’re used to gauge whether the forest offers a “healthy or suitable habitat” to those predators.
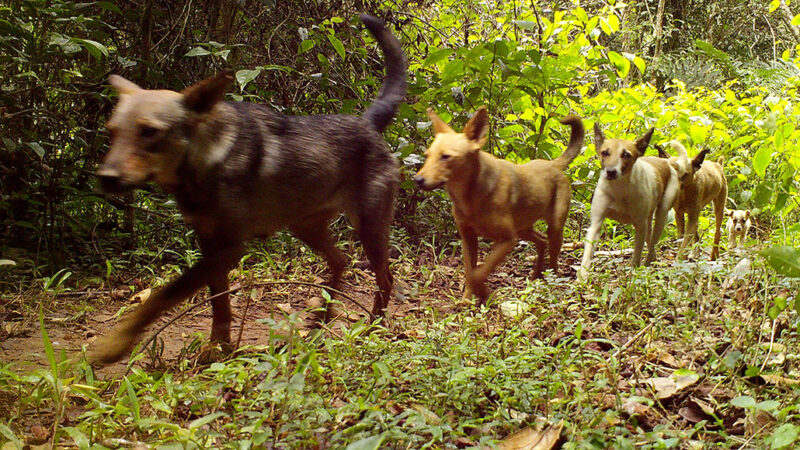
Farris’ team focused on images of fosa and four other types of native carnivores. These included the ring-tailed vontsira (or mongoose), broad-striped vontsira, spotted fanaloka (or striped civet) and a mongoose-like animal called the Eastern falanouc. Pet dogs moving through the area also turned up in the photos.
The photos showed them where animals such as fosa are showing up. They also made it clear where there and other species were absent.
Farris defines a capture as “all of the photos of a given species [taken] within a 30-minute period.” Their 2,918 captures included a lot of pictures. But how often each species showed up varied a lot. That’s one challenge to studying wild creatures. It can be hard to know if and when — or precisely where — they’ll show up.
Researchers refer to how many of something they have to analyze as the sample size. The refer to it as the “n” (for number). For most studies, a large “n” is preferred. It offers more data from which to calculate whether an apparent trend is likely due to something causal — or is just some data-collection fluke.
Here, spotted fanaloka showed up in 157 captures; the falanouc in just two. Broad-striped vontsiras appeared in 31 captures, while the ring-tailed species showed up in just 16. Those fosa appeared in 17 captures, while roaming pet dogs were caught in 72.
All five native carnivores they focused on were using the newly protected area, Farris says. That shows the area indeed “was protecting and housing native animals, mainly carnivores.”
Another key new finding: domestic dogs also hang out here. “We found more photos of dogs and found they covered more of the protected area than almost all of the native carnivores,” Farris says. These data, he adds, suggest dogs could pose threats to Madagascar’s native wildlife.
Farris and his team shared their findings in the September 27, 2020, Endangered Species Research.
Using what you know to learn new things
New often uses a statistical approach known as Bayesian (BAYS-ee-en) statistics. She says it helps deal with the fact “that very little of the world is completely unknown to us.
We all come into every situation that we face with existing knowledge about what we might expect to see.” New uses that prior knowledge to “fill in some of the gaps.” It helps her build models to answer the conservation questions she studies, such as how much wild space certain animals need to thrive.
Many of us have used a similar approach. For instance, have you ever used your textbook, notes from class and old tests to try to anticipate what questions your teacher might ask on your next math test? That’s using prior knowledge to try to fill information gaps.
New used Bayesian statistics when she studied eagle collisions with wind turbines. She created a computer model to help predict how many eagles might collide with a turbine That model, she explains, was “based on our prior knowledge of their risk and exposure to the hazard.”
But when New and her colleagues created that model, she had no data on bald eagle collisions with turbines. Thanks to Bayesian statistics, all wasn’t lost. “We could use our existing knowledge for golden eagles,” she says. It filled in the gap until actual numbers for bald eagle collisions became available. Then her team could update the model.
Even if you don’t have any interest in studying animals, you’ll probably still find yourself doing some type of work that would benefit from statistics.
“There isn’t a field of study or a career that I can think of that doesn’t use mathematics or statistics in some way,” says New. Take a hairdresser. “You’re probably not going to be using statistics while you cut somebody’s hair,” she notes. But the products you use on customers have undergone tests. “How do we figure out if a product actually does make somebody’s hair shine,” she asks? People test it. And how do we know if those tests gave us data we can trust? Simple, New says: “We do statistics.”